Subscriber Insights
Customer Insight provides more detailed info about the customers and users.
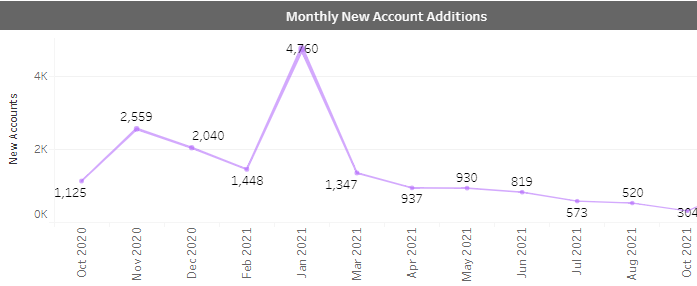
- Monthly New Account Additions - This chart displays the number of new
accounts created based on their creation month. Data is shown for the last 12
months.
- New Accounts Trends Bar - The new accounts bar presents a comparison of
the ratio and number of new accounts in previous months to the reporting month.
Comparison is made for the same period of time as the reporting month.
For example, if the data presented is updated until 10/10/21 (October 10th). The trend from 1 month ago would compare total new accounts from September 1-10 vs. current month new accounts October 1-10.
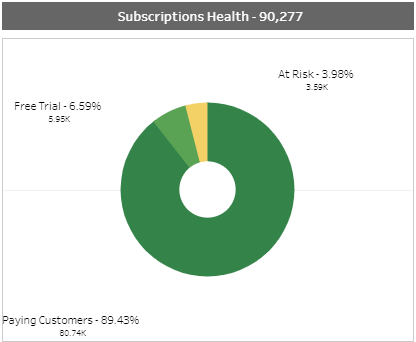
- Subscription Health - Subscription Health is a pie chart showing the
split of the number and percentages of the subscriptions that are paying, on a
free trial, or at risk of being lost (such as subscriptions in grace period,
retry period, or include an unusable payment method). The chart displays
subscriptions added in the last year.
Directions:
- Hover over any part of the pie chart to see a pop-up data box detailing the total number and percentage of the relevant subscription
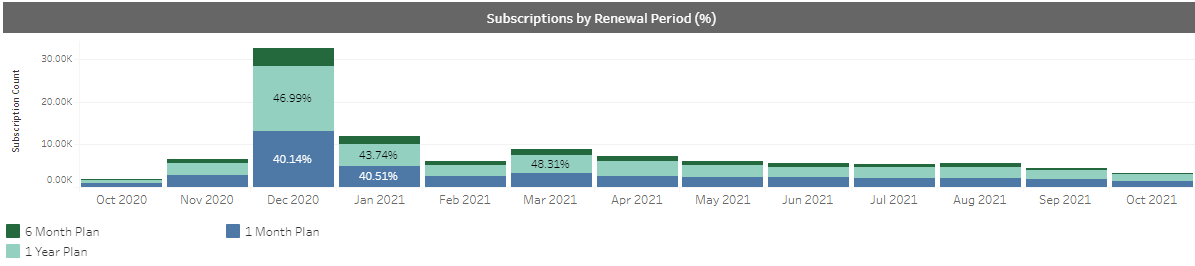
- Subscriptions By Renewal Period % - The column chart shows the
percentages of subscriptions in the last 12 months split by billing plans such
as monthly plans, or yearly plans.
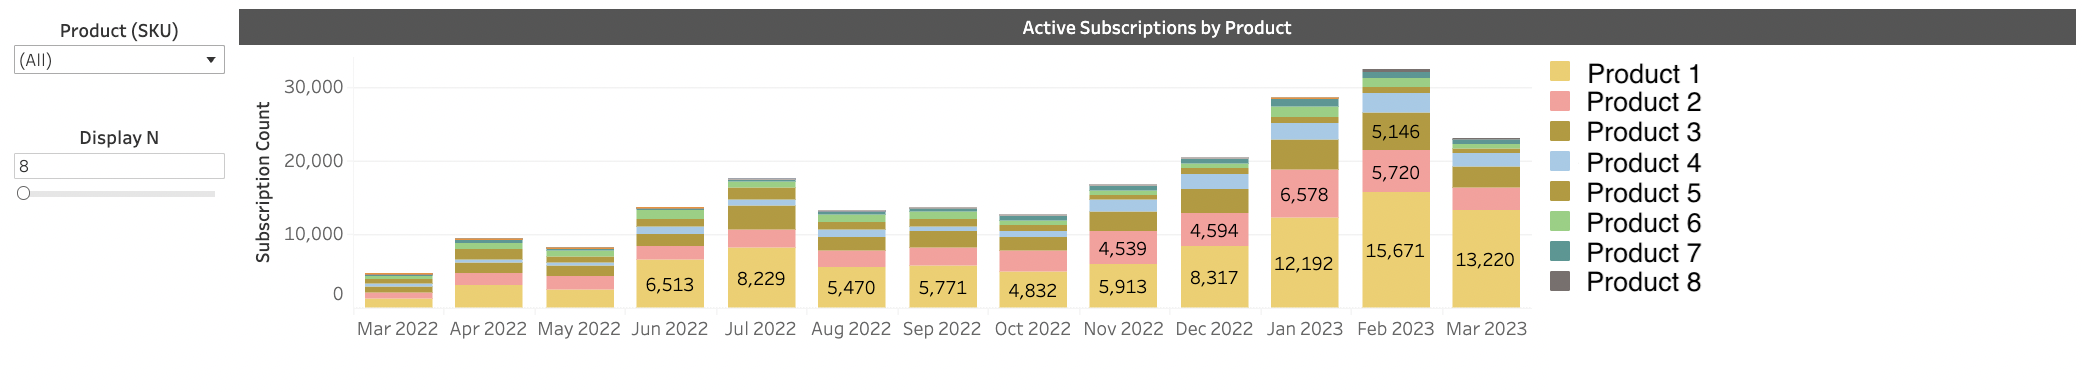
- Active Subscriptions Per Product - This chart is split by month and shows
the number of active subscriptions for each product over the last 12 months.
This chart can be filtered by Product (SKU). The top 14
products are displayed by default, however the number of products that are
displayed can be changed using the Display N
slider.
Directions:
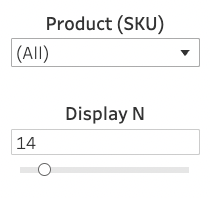
- In the Product (SKU) dropdown list, select which specific products appear or leave All selected.
- Use the Display N slider to select the number of products displayed in the chart. If you have all products selected in the Product (SKU) dropdown list, the Display N filter narrows down the results to the selected number of top performing products.