Chargeback Analysis Dashboard
The Chargeback Analysis Dashboard provides detailed info about chargebacks occurring for Transactions.
The dashboards provides insights on the chargeback rates relative to the transactions processed by Vindicia, the chargeback distribution reasons, and their status. Data will be displayed only for merchants that have a chargeback feed configured.
A chargeback is a reversal of a credit card transaction, typically initiated when a customer disputes the legitimacy of a transaction with the credit card issuer. Chargebacks can be received up to 3 months after a transaction is captured and the numbers depicted will therefore change over time.
The dashboard includes:
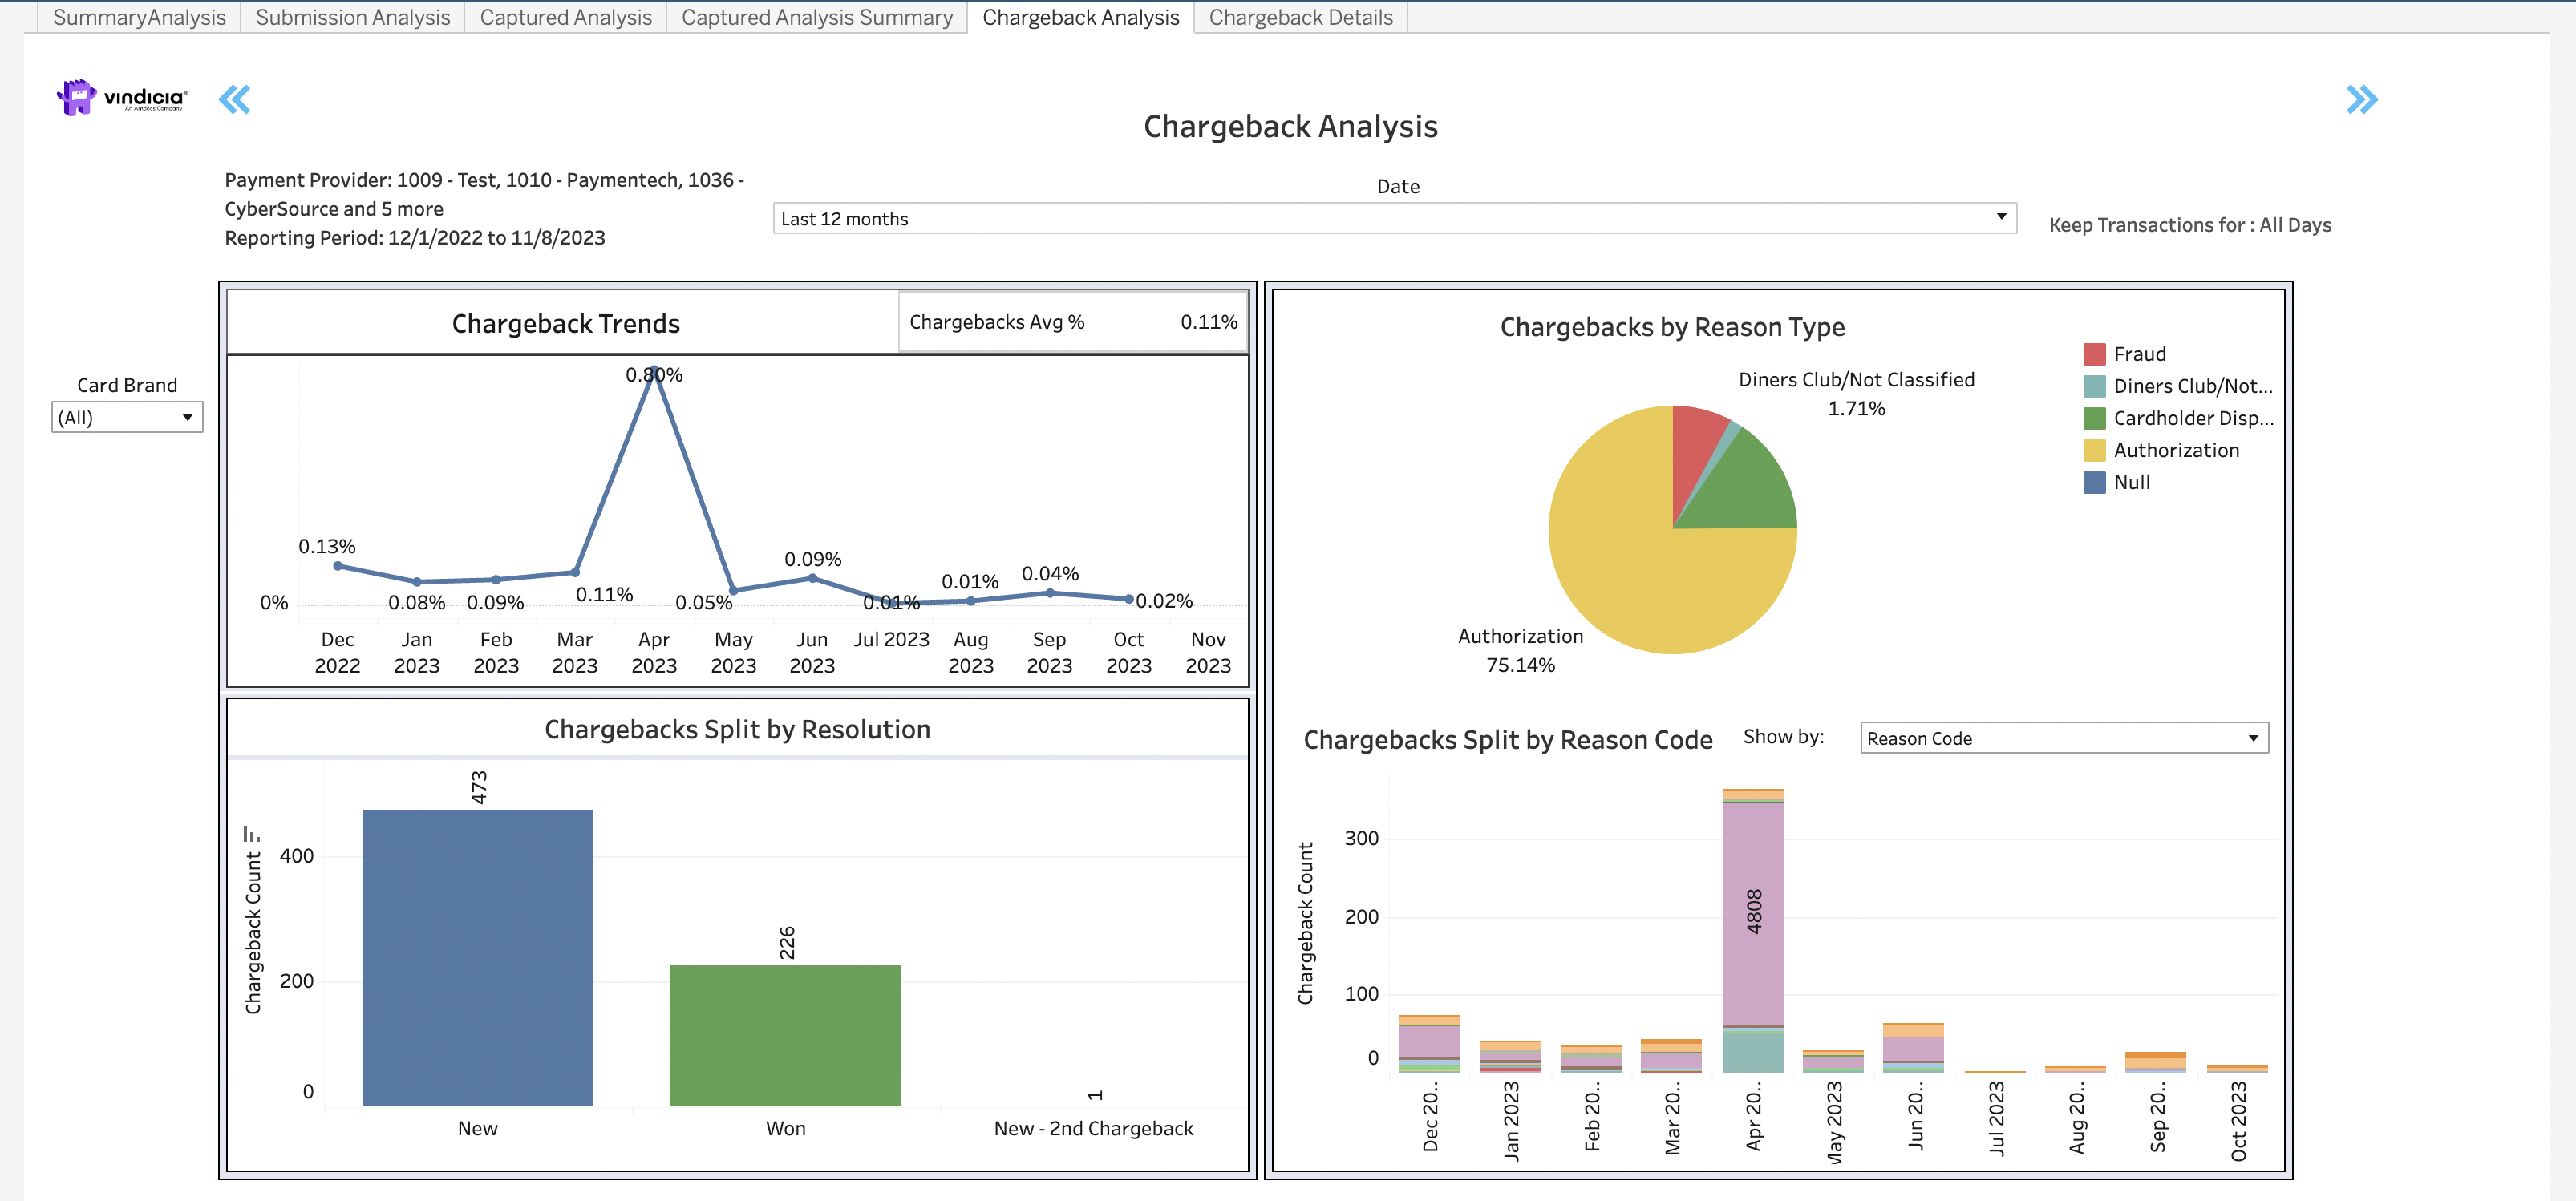
- Chargeback Trends visual diagram - shows the trends of chargeback percentages per month. The chargebacks are displayed based on the transaction captured period not the month the chargeback was filed. Meaning that if a chargeback is received in September for a transaction recovered in July, it will impact the chargeback rate for July.
- Chargeback Split by Resolution chart - provides the breakdown of chargebacks by their terminal status, whether newly received, won back, or appealed.
- Chargebacks by Reason Type pie chart - groups the chargebacks that were filed by the industry based categories for reason types. The reason type grouping by reason codes are detailed in the Chargeback Details tab.
- Chargeback Split by Reason Type - shows a monthly view of the chargeback grouping by the industry based reason types.
Directions
- Hover over any month in the graph to see a pop-up data box with the monthly details.
- Current month displays data up to date 3 days ago. Often this displays partial month revenue and so data may be lower than expected.
- Reporting Period Slider:
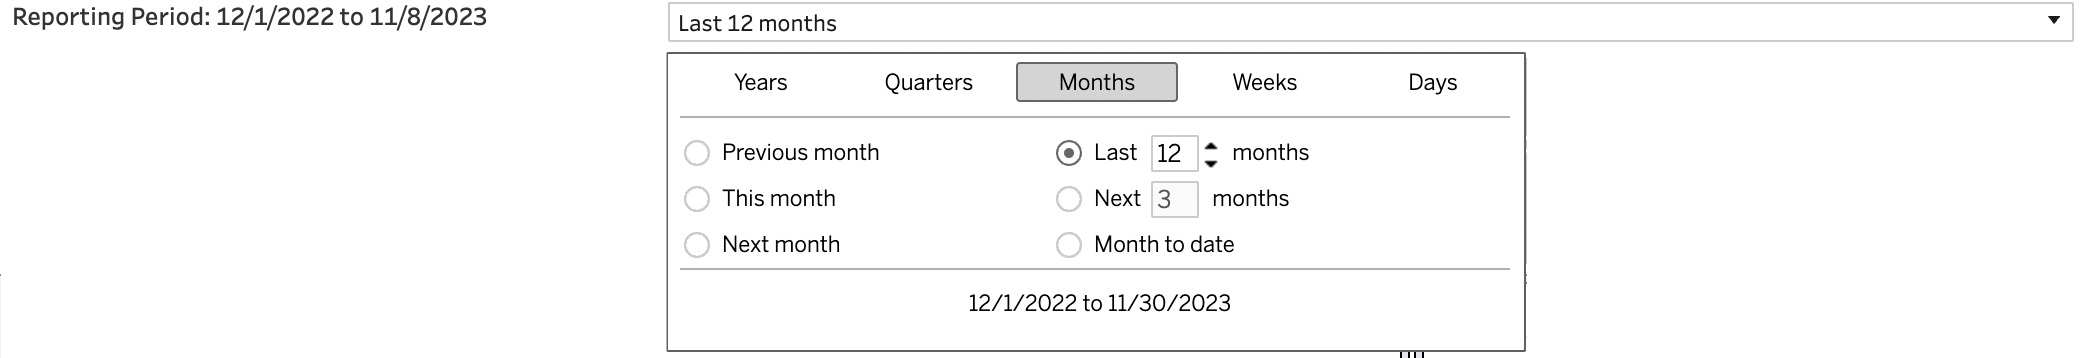 Data for up to 2 years
is available in the Dashboards. Use the slider at the top of the page to
determine the reporting period you'd like to see. By default, a 12 months view
is shown.
Data for up to 2 years
is available in the Dashboards. Use the slider at the top of the page to
determine the reporting period you'd like to see. By default, a 12 months view
is shown.