Revenue Insights
Revenue Insights tab provides more detailed info about your business revenue.
Note: To see revenue split up by Product, see the Revenue by Product tab.
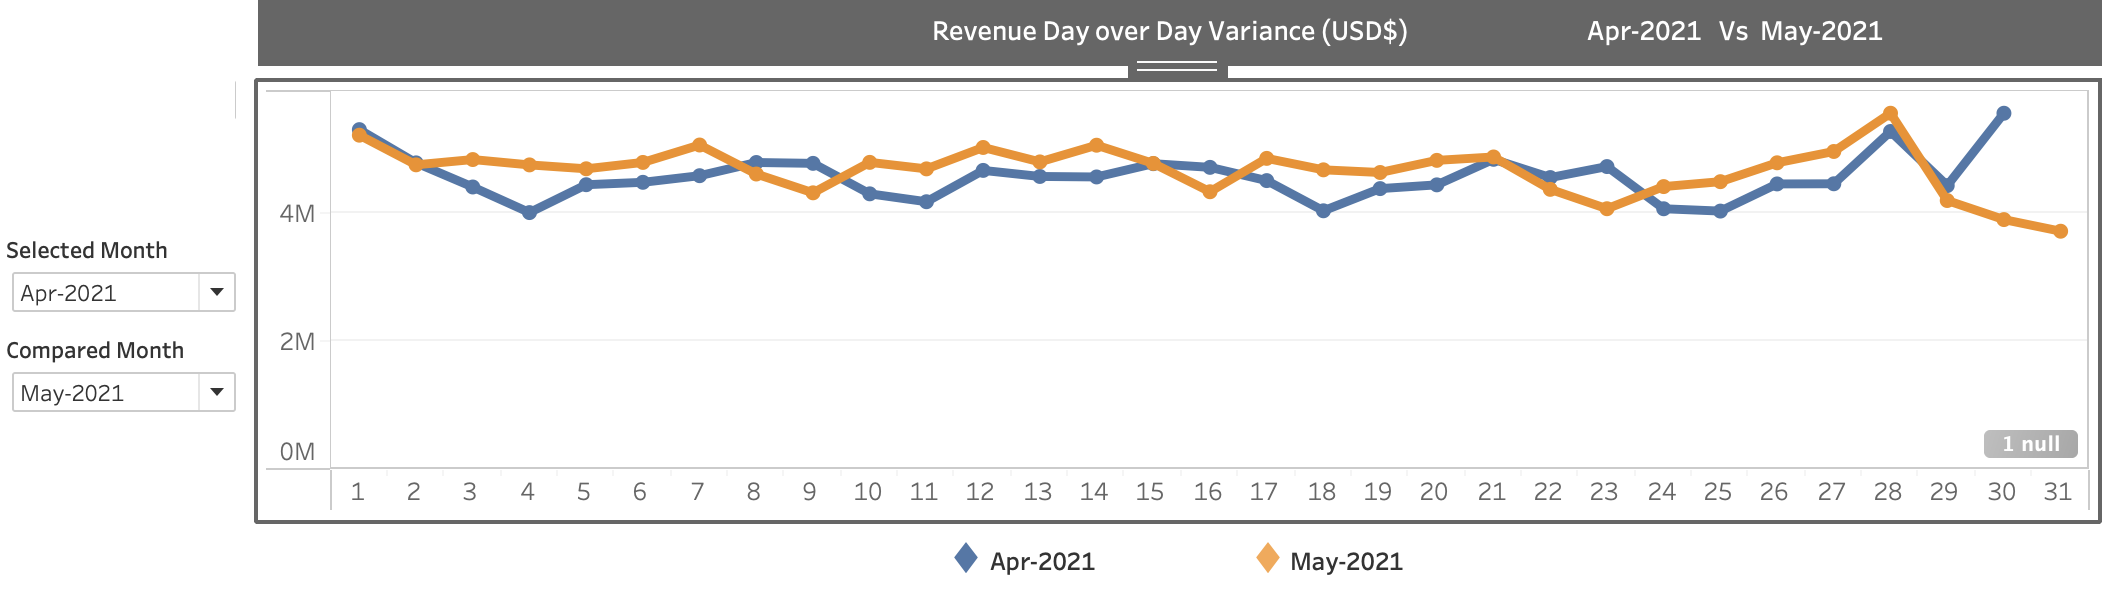
- Revenue Day over Day Variance ($ USD) - You can see the daily revenue trends for two
months to discover and use daily trends. The graph lets you select two
different months in the last 24 months period, a selected month (navy
color) and a compared month (orange color)
- Revenue Trends Bar - The Revenue bar presents the main trends of the selected and
compared month. The selected month serves as the leading one.
- Revenue - the captured revenue of the selected month
- Avg. Transaction - the average captured revenue per transaction of the selected month. This is calculated by dividing all the month's captured revenue by the number of the month's transactions.
- Recovered revenue of the selected month
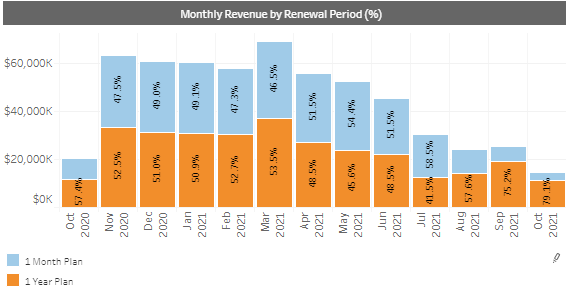
- Monthly Revenue By Renewal Period % - The column chart shows the
subscription frequency percentage of the monthly revenue by all available billing
plans. So you can see what percentage of the month's captured revenue was brought in
by a 1 month plan, or a 1 year plan. This can also help you plan for your future
revenue and retention plans, as you can forecast when most of your longer plans
renew.
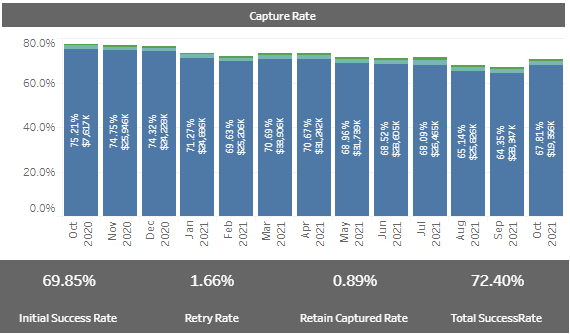
- Capture Rate - This column chart displays the monthly capture rate and
monthly captured revenue (in US Dollars). It also provides details of the initial
success rate, retry rate, Vindicia's Retain capture rate (when relevant), and Total
success rate for each month.
Directions:
- Hover over any month in the graph to see a pop-up data box with the month's capture rates detailed
- Bottom trend bar displays capture rates and retry rates for the last 12 months.