Revenue By Product
Revenue by Product provides insights on how much revenue different products generate each
month. This dashboard allows you to see which of your products are generating the
most revenue whether from a one-time purchase or from subscriptions.
Note: Only products with revenue greater than 0 appear in this dashboard.
To see data displaying the number of active subscriptions per product, see the
Active Subscription per Product chart on the Subscriber Insights
tab.
Directions:
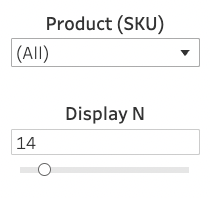
- In the Product (SKU) dropdown list, select specific products to appear or leave All selected to include all products.
- Use the Display N slider to select the number of products displayed in the chart. If you have all products selected in the Product (SKU) dropdown list, the Display N filter narrows down the results to the selected number of top performing products.
- Revenue By Product Graph - This graph shows the percentage of your monthly revenue that
each displayed product generated over the past 12 months. To see your top
perfoming products, select All in the Product
(SKU) dropdown list
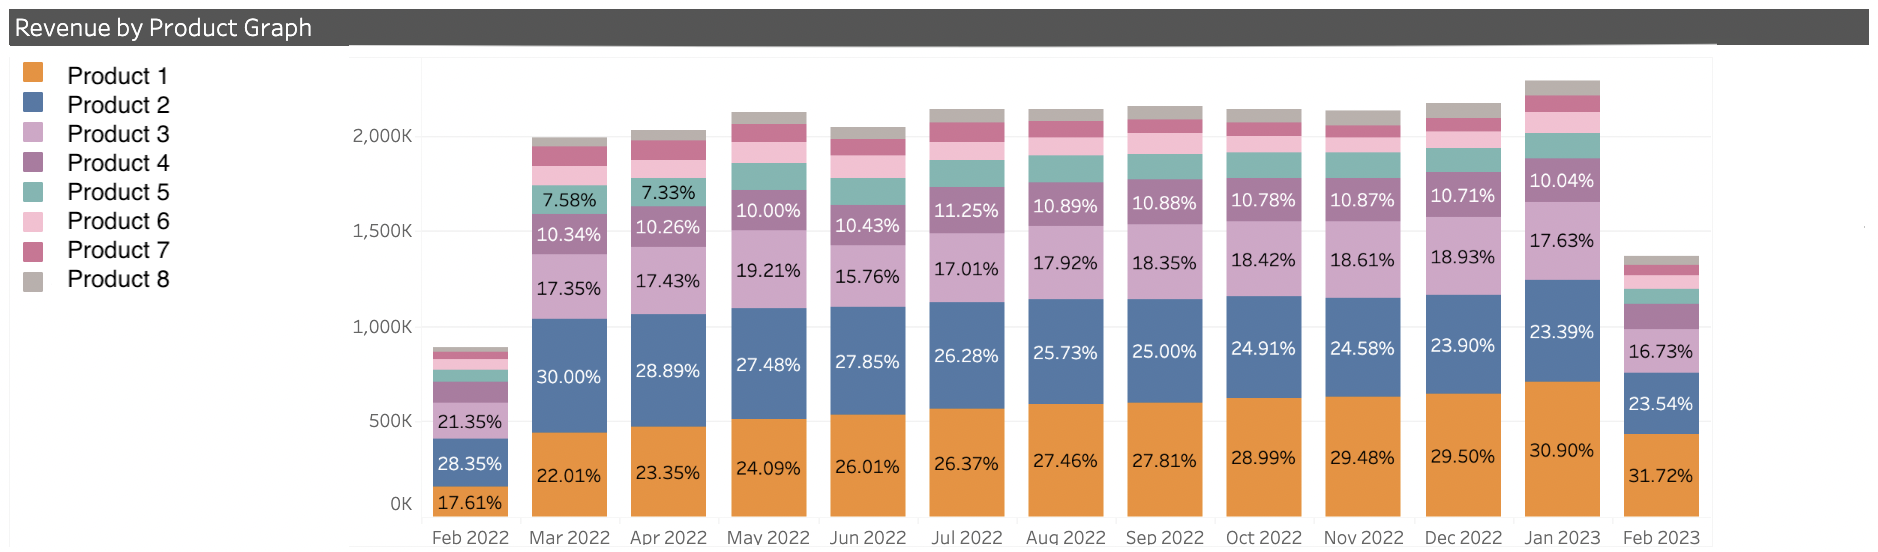 Note: The data for the current month is not complete until the first week of the following month.
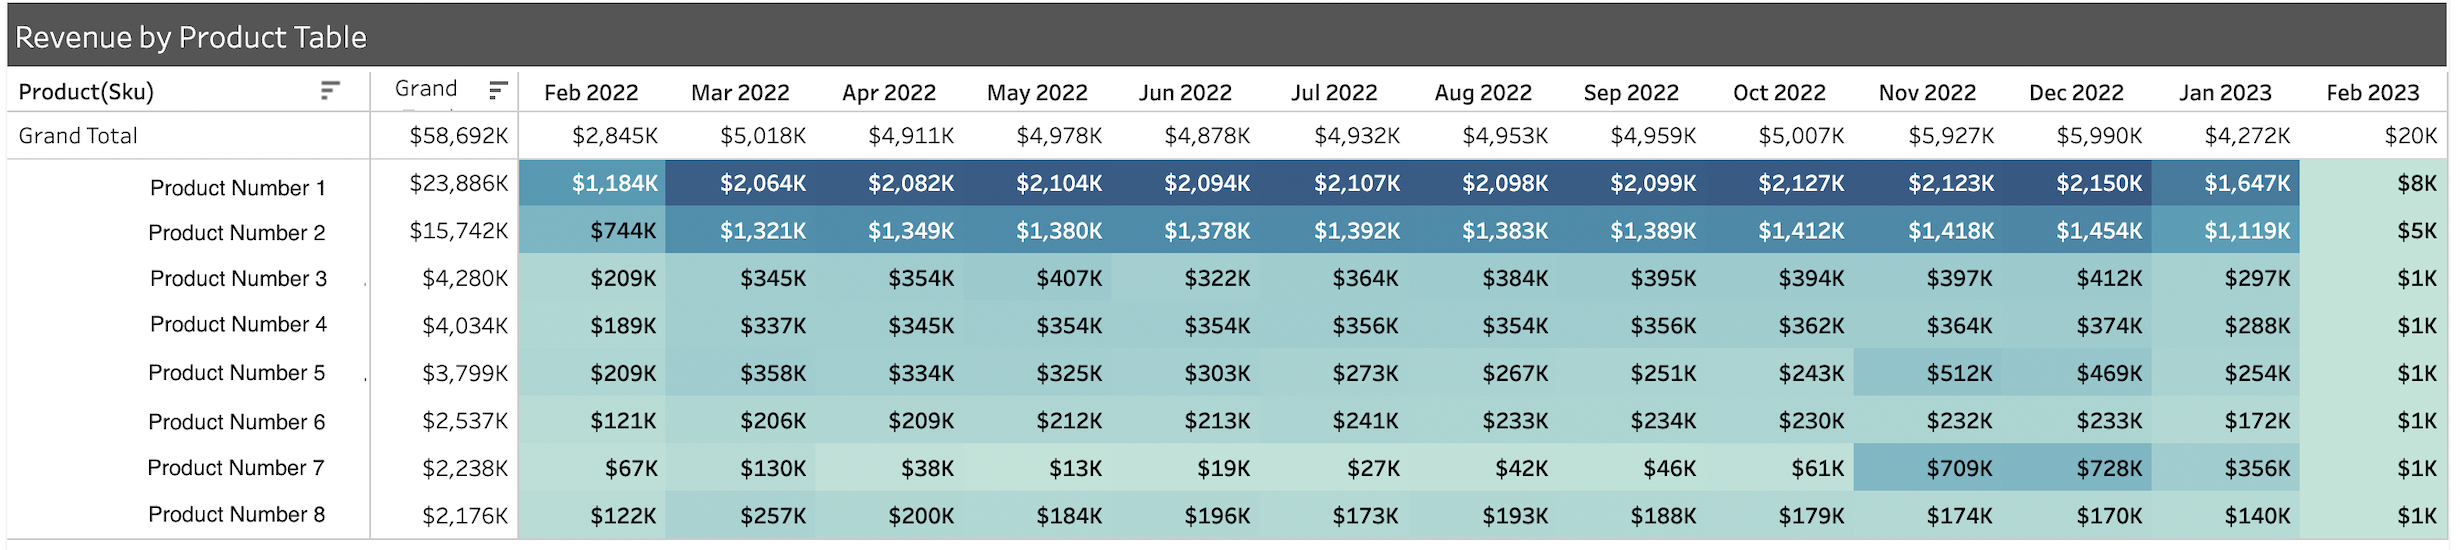
 - Revenue By Product Table - This table displays the revenue (in US Dollars) generated by
each displayed product. It displays the monthly contribution as well as the
annual total.